🍄 edge 알아보기
edge 에 대한 자세한 속성과 타입에 대한 설명은 다음 링크에서 확인 할 수 있다. https://reactflow.dev/api-reference/types/edge
type DefaultEdge<T = any> = {
  id: string;
  type?: string;
  source: string;
  target: string;
  sourceHandle?: string | null;
  targetHandle?: string | null;
  style?: CSSProperties;
  animated?: boolean;
  hidden?: boolean;
  deletable?: boolean;
  data?: T;
  className?: string;
  sourceNode?: Node;
  targetNode?: Node;
  selected?: boolean;
  markerStart?: EdgeMarkerType;
  markerEnd?: EdgeMarkerType;
  zIndex?: number;
  ariaLabel?: string;
  interactionWidth?: number;
  focusable?: boolean;
  updatable?: EdgeUpdatable;
} & EdgeLabelOptions;
다양한 edges 를 보여주기 위해, 여러개의 nodes를 생성하여 적용해보았다.
const initialNodes = [
  {
    id: "1-1",
    type: "custom",
    data: {
      label: "",
    },
    position: { x: 100, y: 100 },
  },
  {
    id: "1-2",
    type: "custom",
    data: {
      label: "",
    },
    position: { x: 349, y: -1 },
  },
  {
    id: "1-3",
    type: "custom",
    data: {
      label: "",
    },
    position: { x: 334, y: 281 },
  },
  {
    id: "2-2",
    data: {
      label: "",
    },
    type: "custom",
    position: { x: 592, y: 162 },
  },
  {
    id: "2-3",
    type: "custom",
    data: {
      label: "",
    },
    position: { x: 813, y: 162 },
  },
  {
    id: "3-2",
    type: "custom",
    position: { x: 1009, y: 32 },
    data: {
      label: "",
    },
  },
  {
    id: "3-1",
    type: "custom",
    position: { x: 1137, y: 398 },
    data: {
      label: "",
    },
  },
];

const initialEdges = [
  {
    id: "e1-2",
    source: "1-1",
    target: "1-2",
    label: "edge",
    type: "smoothstep",
  },
  {
    id: "e1-3",
    source: "1-1",
    target: "1-3",
    animated: true,
    label: "animated edge",
  },
  {
    id: "e2-2",
    source: "1-2",
    target: "2-2",
    type: "smoothstep",
    markerEnd: {
      type: MarkerType.ArrowClosed,
    },
  },
  {
    id: "e2-3",
    source: "2-2",
    target: "2-3",
    type: "smoothstep",
    markerEnd: {
      type: MarkerType.ArrowClosed,
    },
  },
  {
    id: "e3-3",
    source: "2-3",
    sourceHandle: "a",
    target: "3-2",
    type: "button",
    animated: true,
    style: { stroke: "rgb(158, 118, 255)", strokeWidth: 2 },
  },
  {
    id: "e3-4",
    source: "2-3",
    sourceHandle: "b",
    target: "3-1",
    type: "button",
    style: { strokeWidth: 2 },
  },
];
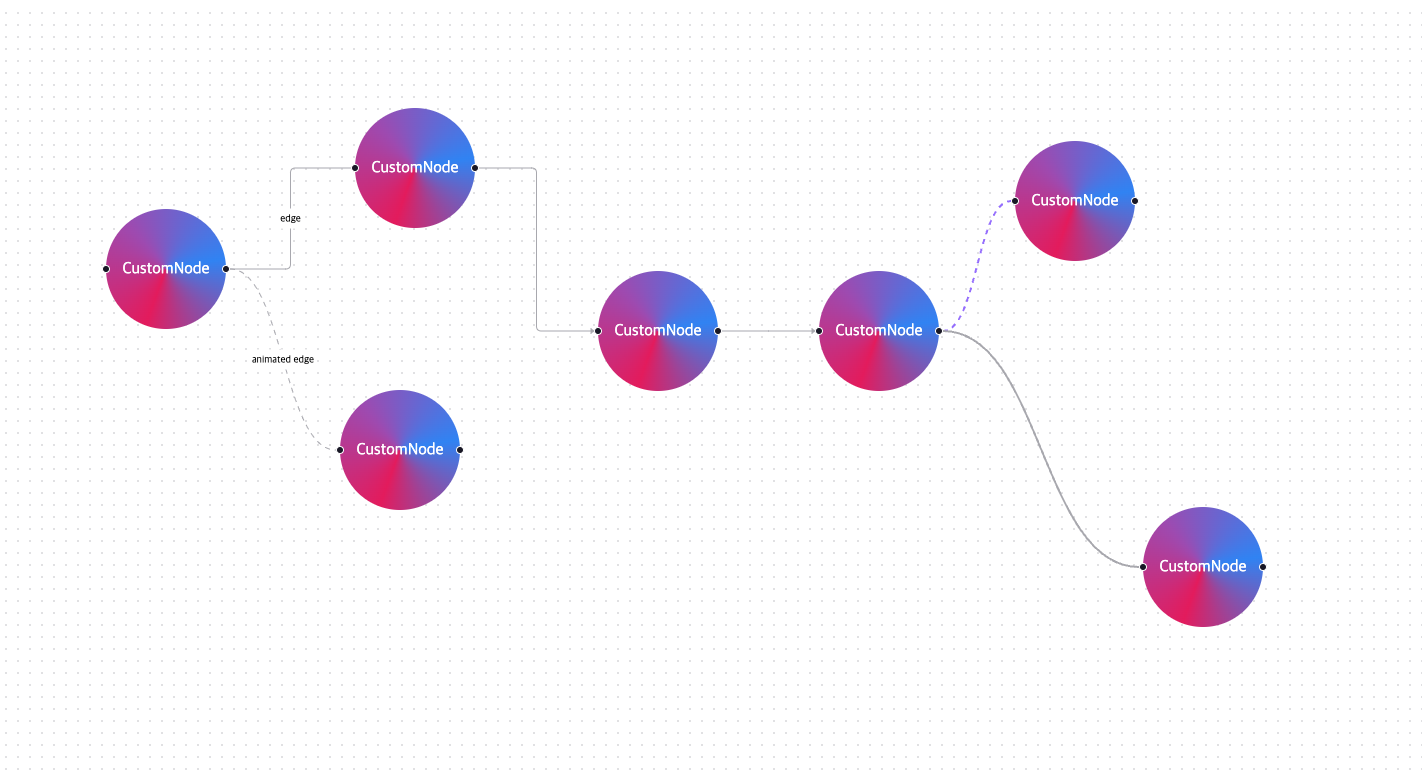
이처럼 edge를 활용하여 다양한 점선의 모양을 표현해볼 수 있다.
🍄 전체 코드
import React, { useCallback } from "react";
import ReactFlow, {
  MiniMap,
  Controls,
  Background,
  useNodesState,
  useEdgesState,
  addEdge,
  Connection,
  Edge,
  MarkerType,
} from "reactflow";

import "reactflow/dist/style.css";
import CustomNode from "./CustomNode";
import styled from "styled-components";

const initialNodes = [
  {
    id: "1-1",
    type: "custom",
    data: {
      label: "",
    },
    position: { x: 100, y: 100 },
  },
  {
    id: "1-2",
    type: "custom",
    data: {
      label: "",
    },
    position: { x: 349, y: -1 },
  },
  {
    id: "1-3",
    type: "custom",
    data: {
      label: "",
    },
    position: { x: 334, y: 281 },
  },
  {
    id: "2-2",
    data: {
      label: "",
    },
    type: "custom",
    position: { x: 592, y: 162 },
  },
  {
    id: "2-3",
    type: "custom",
    data: {
      label: "",
    },
    position: { x: 813, y: 162 },
  },
  {
    id: "3-2",
    type: "custom",
    position: { x: 1009, y: 32 },
    data: {
      label: "",
    },
  },
  {
    id: "3-1",
    type: "custom",
    position: { x: 1137, y: 398 },
    data: {
      label: "",
    },
  },
];

const initialEdges = [
  {
    id: "e1-2",
    source: "1-1",
    target: "1-2",
    label: "edge",
    type: "smoothstep",
  },
  {
    id: "e1-3",
    source: "1-1",
    target: "1-3",
    animated: true,
    label: "animated edge",
  },
  {
    id: "e2-2",
    source: "1-2",
    target: "2-2",
    type: "smoothstep",
    markerEnd: {
      type: MarkerType.ArrowClosed,
    },
  },
  {
    id: "e2-3",
    source: "2-2",
    target: "2-3",
    type: "smoothstep",
    markerEnd: {
      type: MarkerType.ArrowClosed,
    },
  },
  {
    id: "e3-3",
    source: "2-3",
    sourceHandle: "a",
    target: "3-2",
    type: "button",
    animated: true,
    style: { stroke: "rgb(158, 118, 255)", strokeWidth: 2 },
  },
  {
    id: "e3-4",
    source: "2-3",
    sourceHandle: "b",
    target: "3-1",
    type: "button",
    style: { strokeWidth: 2 },
  },
];

const NodeTypes = {
  custom: CustomNode,
};

const ReactFlowExample = () => {
  const [nodes, setNodes, onNodesChange] = useNodesState(initialNodes);
  const [edges, setEdges, onEdgesChange] = useEdgesState(initialEdges);
  console.log(nodes, edges, "edges");
  const onConnect = useCallback(
    (params: Edge | Connection) => setEdges((eds) => addEdge(params, eds)),
    [setEdges]
  );

  return (
    <div style={{ width: "100vw", height: "100vh" }}>
      <ReactFlowStyled
        nodes={nodes}
        edges={edges}
        onNodesChange={onNodesChange}
        onEdgesChange={onEdgesChange}
        onConnect={onConnect}
        nodeTypes={NodeTypes}
      >
        <Controls />
        <MiniMap />
        <Background gap={12} size={1} />
      </ReactFlowStyled>
    </div>
  );
};
export default ReactFlowExample;

const ReactFlowStyled = styled(ReactFlow)`
  .react-flow__node-custom {
    width: 120px;
    height: 120px;
    background: conic-gradient(
      from -160deg at 50% 50%,
      #e92a67 0deg,
      #a853ba 120deg,
      #2a8af6 240deg,
      #e92a67 360deg
    );
    border-radius: 100%;
    color: #fff;
    display: flex;
    align-items: center;
    justify-content: center;
  }
`;
'FE' 카테고리의 다른 글
| [ReactFlow] 다이어그램툴 드래그앤드랍 기능추가 #4 (0) | 2024.10.30 |
|---|---|
| [ReactFlow] 다이어그램툴 레이아웃 잡기 #3 (0) | 2024.10.30 |
| [ReactFlow] 다이어그램 툴 만들기 #1 (0) | 2024.10.30 |
| [ReactFlow] 다이어그램 툴 만들기 #0 (3) | 2024.10.30 |
| [ChartJS / react-chartjs-2] 클릭이벤트 적용해보기 #5 (0) | 2024.10.29 |