다른 차트 형태들은 예시가 많이 올라와있어서 비교적 예시가 적은 믹스형 차트에 대해 알아보고, 클릭 이벤트 등등을 적용해보고자 한다.
options와 그 외 기본적인 세팅들은 앞선 포스팅들을 참고해 주면 좋다!
먼저 예시 데이터를 어떤걸로 할지 고민하다가 npm trends 사이트의 차트를 응용해 보기로 하였다!
react vs vue - npm trends 링크 참고

npm trends 를 참고하여, react / vue에 대한 line 차트와 두 가지의 합계를 나타내는 총합계에 대한 bar 차트를 혼합하여 표현하고자 한다.
🍄 Mix 형 더미 데이터 넣기
기본적인 데이터 구조는 다음과 같이 잡았다.
import { Chart } from "react-chartjs-2";

import {
  ArcElement,
  BarElement,
  CategoryScale,
  Chart as ChartJS,
  Legend,
  LineElement,
  LinearScale,
  PointElement,
  Tooltip,
  registerables,
} from "chart.js";

ChartJS.register(
  ...registerables,
  LinearScale,
  CategoryScale,
  BarElement,
  PointElement,
  LineElement,
  Legend,
  Tooltip,
  ArcElement
);

const MixChartExample = () => {
  const react_dummy = [10, 10, 10, 10, 20, 20, 20, 20, 30, 30, 30, 30];
  const vue_dummy = [10, 30, 10, 10, 10, 20, 30, 30, 20, 20, 20, 30];
  const total_dummy = react_dummy.map((item, idx) => item + vue_dummy[idx]);
  const labels_dummy = new Array(12).fill(0).map((_, idx) => idx + 1 + "월");
  //chart data
  const mixData = {
    labels: labels_dummy,
    datasets: [
      {
        type: "line" as const,
        label: "React" as string,
        data: react_dummy,
        borderColor: "#DD5353",
        backgroundColor: "#DD5353",
        borderWidth: 2, // 선의 크기
        pointBorderWidth: 1, // point의 크기
        tension: 0.1, // line 차트일 경우 선의 휘어짐 정도
      },
      {
        type: "line" as const,
        label: "Vue" as string,
        data: vue_dummy,
        borderColor: "#5F9DF7",
        backgroundColor: "#5F9DF7",
        borderWidth: 2,
        pointBorderWidth: 1,
        tension: 0.1, // line 차트일 경우 선의 휘어짐 정도
      },
      {
        type: "bar" as const,
        label: "전체" as string,
        backgroundColor: "#ddd",
        data: total_dummy,
        borderColor: "#ddd",
        borderWidth: 2,
      },
    ],
  };

  return (
    <div>
      <Chart type="bar" data={mixData} />
    </div>
  );
};
export default MixChartExample;
data에 작성한 옵션들은 아래 링크들을 참고하여 추가할 수 있다.
point style 참고 문서 - ChartJS Line형 차트 옵션 참고 문서 - ChartJS
Line Chart | Chart.js
Line Chart A line chart is a way of plotting data points on a line. Often, it is used to show trend data, or the comparison of two data sets. const config = { type: 'line', data: data, };const config = { type: 'line', data: data, }; const labels = Utils.mo
www.chartjs.org
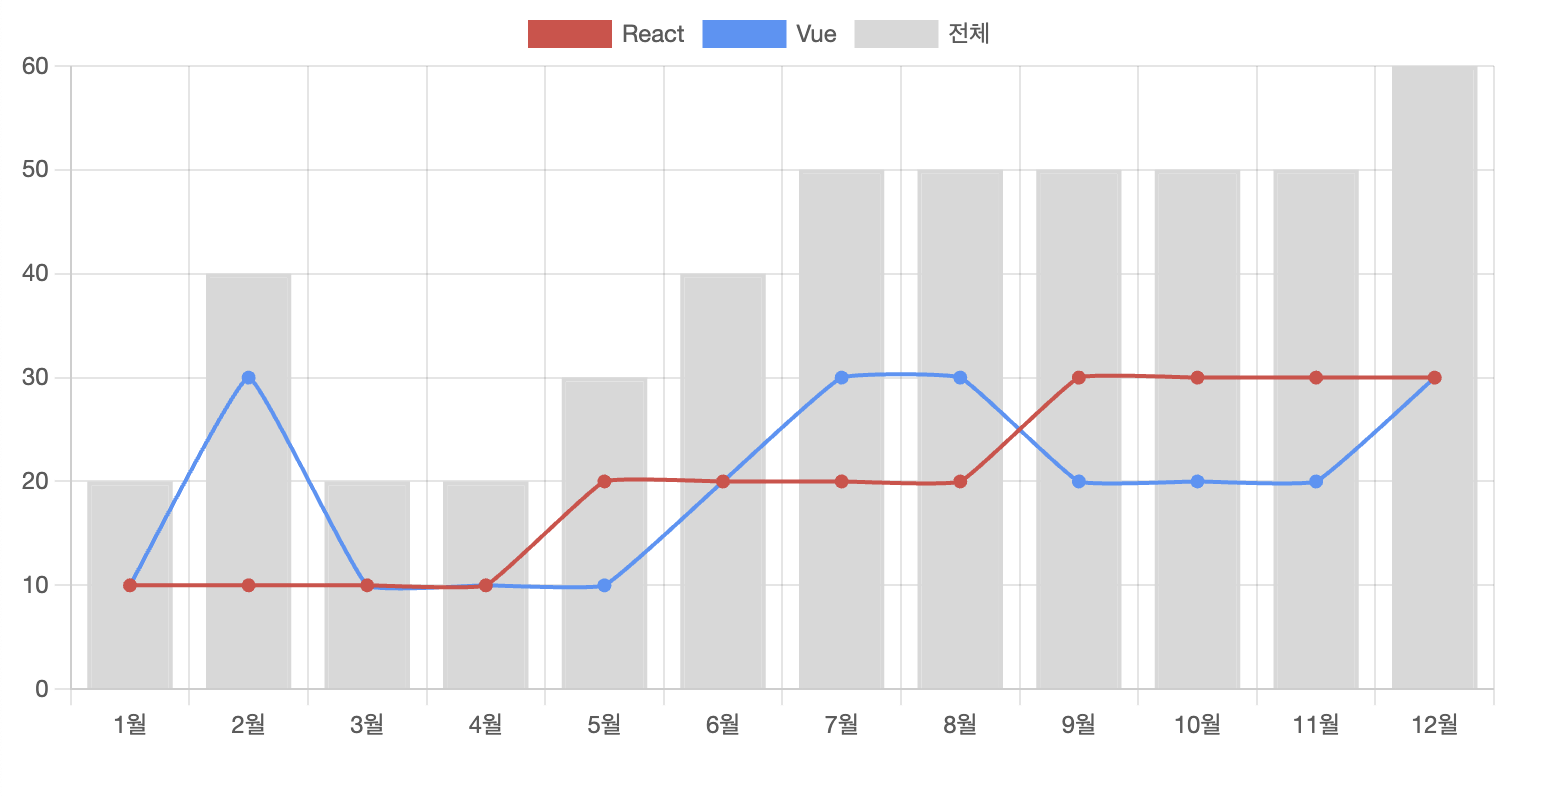
현재까지 잡힌 화면 ⭐️
🍄 options 추가해보기
1️⃣ labels의 간격을 최대 간격 지정해 주기 (maxTicksLimit)
실무에서 쓰다 보면, labels가 유동적인 경우가 있다. 예를 들어, 한 차트에서 3개월 - 1개월 - 일주일 간격의 데이터를 보여줘야 하는 상황에서 labels를 있는 그대로 표현해 준다면 화면에 내용이 너무 꽉 찰 수가 있다.
화면이 크다면 상관이 없지만, 작은 화면에서 3개월 치의 labels를 다 보여주기는 어려울 것이다!
chartJS에서는 이와 같은 옵션을 제공해주고 있다!! 다음과 같이 옵션을 채워줄 수 있다.
  const mixOptions = {
    scales: {
      x: {
        ticks: {
          maxTicksLimit: 6,
        },
      },
    },
  };
// 생략

    <div>
      <Chart type="bar" data={mixData} options={mixOptions}/>
    </div>

이미지를 보면, 최대 6개까지로 labels 가 고정되었단 것을 알 수 있다.
2️⃣ y축의 높이를 컨트롤해보자!
이번에는 한번 react_flex_dummy를 만들어보고, 해당 데이터를 react 쪽에 넣어보겠다.
  const react_flex_dummy = [
    10, 10, 1000, 10, 20, 200, 20, 20, 330, 30, 1130, 30,
  ];
// 생략
  const mixData = {
    labels: labels_dummy,
    datasets: [
      {
        type: "line" as const,
        label: "React" as string,
        data: react_flex_dummy,
        ...
이와 같이 데이터 차이가 1000 이상 날 경우, 다음처럼 chart의 높이가 큰 차이를 내며 표시될 것이다.
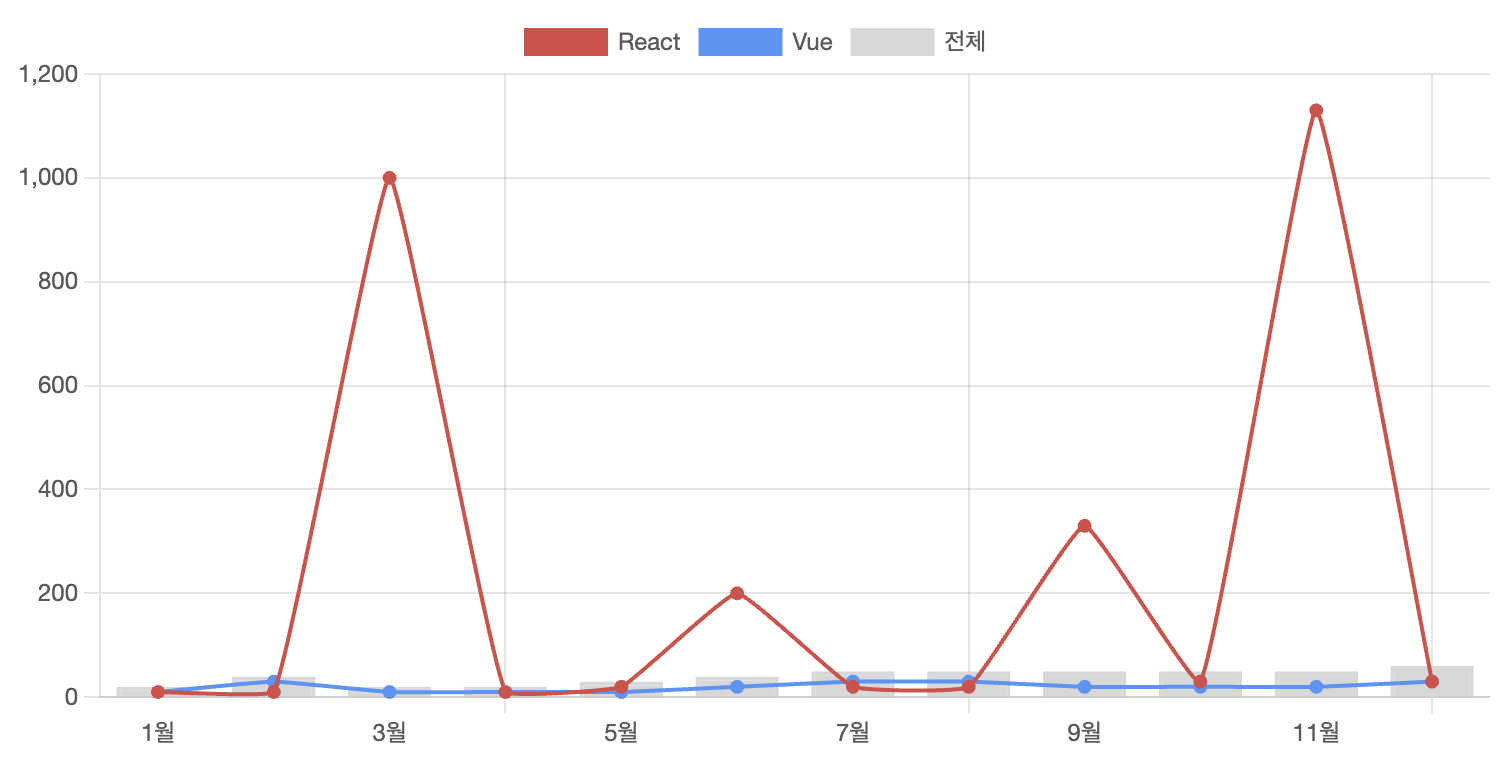
보면... 최댓값이 너무너무 클 경우, 다른 데이터들이 바닥에 희미하게 보이는 것을 알 수 있다.. 😢
y축에 대해서도 ticks 옵션에 stepSize를 지정해 주면 되는데, labels와 다르게 data의 범위는 매우 유동적이기 때문에 특정 숫자를 지정해 주기 애매할 수가 있다...
data가 최대 몇부터 최소 몇까지 들어올지 모르기 때문이다!
☀️ 데이터의 max 값과 min 값을 활용하여 stepSize를 유동적으로 잡아주는 함수를 만들어보자!
데이터가 들어올 때마다, 데이터의 최댓값, 최솟값을 받아 간격을 잡아주는 함수를 만들어볼 수 있다.
const getStepSize = (min: number, max: number) => {
  const range = max - min; // 최댓값과 최솟값 간의 범위를 계산
  const interval = Math.ceil(range / 3); // 범위를 3등분하여 각 구간의 크기를 계산
  const exponent = Math.floor(Math.log10(interval)); // 각 구간의 크기에 대한 로그 값을 계산
  const factor = Math.pow(10, exponent); // 10의 거듭제곱을 통해 가장 가까운 10의 배수로 구간 크기를 정규화
  return Math.ceil(interval / factor) * factor;
};
total_dummy를 이용하여 min 값과 max 값을 정하여 적용해 주면 다음과 같이 react_flex_dummy와 react_dummy에 따라 y축의 간격이 조정되는 것을 볼 수 있다 ⭐️
react_flex_dummy 인 경우

react_dummy 인 경우

전체적인 코드는 다음과 같다! 다음 포스팅에서는 클릭 이벤트를 적용해 보겠다!
import { Chart } from "react-chartjs-2";

import {
  ArcElement,
  BarElement,
  CategoryScale,
  Chart as ChartJS,
  Legend,
  LineElement,
  LinearScale,
  PointElement,
  Tooltip,
  registerables,
} from "chart.js";
import { useMemo } from "react";

ChartJS.register(
  ...registerables,
  LinearScale,
  CategoryScale,
  BarElement,
  PointElement,
  LineElement,
  Legend,
  Tooltip,
  ArcElement
);

const MixChartExample = () => {
  const react_dummy = [10, 10, 10, 10, 20, 20, 20, 20, 30, 30, 30, 30];
  // const react_flex_dummy = [
  //   10, 10, 1000, 10, 20, 200, 20, 20, 330, 30, 1130, 30,
  // ];
  const vue_dummy = [10, 30, 10, 10, 10, 20, 30, 30, 20, 20, 20, 30];
  const total_dummy = react_dummy.map((item, idx) => item + vue_dummy[idx]);
  const labels_dummy = new Array(12).fill(0).map((_, idx) => idx + 1 + "월");

  // 최대,최소값을 구하는
  const min = useMemo(() => {
    return Math.min.apply(null, total_dummy);
  }, [total_dummy]);

  const max = useMemo(() => {
    return Math.max.apply(null, total_dummy);
  }, [total_dummy]);

  const mixOptions = {
    scales: {
      x: {
        ticks: {
          maxTicksLimit: 6,
        },
      },
      y: {
        ticks: {
          color: "#808080",
          stepSize: getStepSize(min, max),
        },
      },
    },
  };
  //chart data
  const mixData = {
    labels: labels_dummy,
    datasets: [
      {
        type: "line" as const,
        label: "React" as string,
        data: react_dummy,
        borderColor: "#DD5353",
        backgroundColor: "#DD5353",
        borderWidth: 2, // 선의 크기
        pointBorderWidth: 1, // point의 크기
        tension: 0.1, // line 차트일 경우 선의 휘어짐 정도
      },
      {
        type: "line" as const,
        label: "Vue" as string,
        data: vue_dummy,
        borderColor: "#5F9DF7",
        backgroundColor: "#5F9DF7",
        borderWidth: 2,
        pointBorderWidth: 1,
        tension: 0.1, // line 차트일 경우 선의 휘어짐 정도
      },
      {
        type: "bar" as const,
        label: "전체" as string,
        backgroundColor: "#ddd",
        data: total_dummy,
        borderColor: "#ddd",
        borderWidth: 2,
      },
    ],
  };

  return (
    <div>
      <Chart type="bar" data={mixData} options={mixOptions} />
    </div>
  );
};
export default MixChartExample;
const getStepSize = (min: number, max: number) => {
  const range = max - min; // 최댓값과 최솟값 간의 범위를 계산
  const interval = Math.ceil(range / 3); // 범위를 3등분하여 각 구간의 크기를 계산
  const exponent = Math.floor(Math.log10(interval)); // 각 구간의 크기에 대한 로그 값을 계산
  const factor = Math.pow(10, exponent); // 10의 거듭제곱을 통해 가장 가까운 10의 배수로 구간 크기를 정규화
  return Math.ceil(interval / factor) * factor;
};'FE' 카테고리의 다른 글
| [ReactFlow] 다이어그램 툴 만들기 #0 (3) | 2024.10.30 |
|---|---|
| [ChartJS / react-chartjs-2] 클릭이벤트 적용해보기 #5 (0) | 2024.10.29 |
| [ChartJS / react-chartjs-2] options 를 알아보기 #3 (0) | 2024.10.29 |
| [ChartJS / react-chartjs-2] 완벽한 반응형 차트를 구현해보자 #2 (0) | 2024.10.29 |
| [ChartJS / react-chartjs-2] 차트 라이브러리 설치, 기본 세팅하기 #1 (0) | 2024.10.29 |